Redirect

Thursday, June 26, 2008

T2108 Update

Thankfully, it appears my status as a "Spam Blog" has been removed and I'm free to post to Blogger once again. Though, some of you may think this blog is just as spammy as ever. Ha. Spurred on by Stewie's exuberance here is an update on the Worden TeleChart T2108 indicator.

T2108 is an indicator which tracks the % of stocks that are above their 40 day moving averages. It's worked very well in the past as an indicator that gets you long when everyone else is experiencing maximum amounts of pain. I first picked up on this indicator a few years back when Gary B Smith, formerly of TheStreet.com, would reference it constantly.

We're at 15.00 as of the close today. This is below the levels we hit in Jan and Mar of this year and just above the Nov 07 lows (hit about 13). The Aug 07 lows hit 7.7.


Friday, June 20, 2008

T2108 - Oversold Indicator


The vaunted Worden TeleChart T2108 indicator is beginning to approach levels that are more associated with bottoms than tops. I'd be careful with shorts here and start making your long watch lists. We may not bounce today, tomorrow or even next week but it is important to be ready for when we do.

Thursday, June 19, 2008

GOOG


I went long a pretty good sized position in GOOG today on the chart pattern below. My entry was at 553 and I'm holding overnight for now. Got out of the MON today as well as ferts don't look safe for now.

Wednesday, June 18, 2008

Interesting Note from Hamzei Analytics

"Our Market Pulse Indicator (MPI) is getting ready to setup for a [ROYAL] FLUSH of the weak longs. Once we are thru that painful process, we should be ready for a blast off. The window is 2 to 5 days. Brace Yourself."
This and more at their site: Hamzei Analytics

Tuesday, June 17, 2008

Watchlist for 6/18/08

Here is a picture of my watchlist for tomorrow. The flagged stocks are particularly interesting to me.


Solid Day

I've had a pretty good day so I don't have room to complain but it's hard not to wonder what could have been. Check out the list of stocks I had identified for potential buys today and their performance on the day (listed in the sort value column)


I'm currently in some MON, NE and NBL as they are breaking out or looking like they will soon. Oil and Ferts - stick with what is working.

FLR Looks Ready for New Highs


FLR is looking great on the daily. Poised for new highs soon.

Monday, June 16, 2008

Setups I'm Watching

Took it pretty easy today. Caught about half a point or so on MOS and POT and then picked up some APWR at 25.80 and decided to keep it overnight as it closed at the highs.


Thursday, June 12, 2008

Bo Yoder Update

An update from Bo Yoder today:

This market desperately needs to form a higher low, as any retest of the "peek" double bottom we formed in would be an extraordinarily bearish event.

Normally, when a breakdown occurs after a "peek" double bottom, prices will fall about as far as they did prior to the bottom's formation. If this projection is made, it would put us at the 1,000 point level for the S&P 500. We have plenty of room for reversal before any breakdown can occur, and I hope that the bulls are interested in defending the bottom in the months to come.

This and more at his very helpful website: The Five Minute Investor with Bo Yoder

Bounce Near?

Rob Hanna is out with another great post - this time referencing the McClellan Oscillator and what that it is saying about the long side in the comings days / weeks. Well worth your time:

Link: What The McClellan Oscillator Is Suggesting

Wednesday, June 11, 2008

That Kind of Day - FSLR


I violated my own rules and gave FSLR a shot on the short side. Top ticked the sucker - wonderful. Lost 1.26 / share instead of being up well over 5.00 / share

Linda Raschke Interview Notes

On June 5 I participated in an interview / conference call with Linda Raschke. Raschke is likely most known for her excellent track record as a short term S&P 500 futures trader. I took some notes during the call and have done my best to make sense of my scribbles below

Two additional sources of great information on Linda can be found here:
1) “Linda Bradford-Raschke’s 5 trading patterns” (PDF document)

2) The New Market Wizards: Conversations with America’s Top Traders by Jack D. Schwager (Amazon Link)

Below are my notes on her thoughts:

WHERE SHE TRADES:

95% of profitability is on futures
Have a game plan before the market opens
ABC setups
120 Minute flags

HOW TO BECOME A PROFESSIONAL TRADER:

1) Practice - similar to golfer or musician
2) Do it, model, after 2-3 years hope to see some improvement and proficiency and find a niche that works for you
3) Make trades. 1 trade, 100 trades, 1000 trades, 5000 trades. After 5000 you should hopefully have a level of proficiency.

FAVORITE BOOKS:

Favorite money management book:

Kenneth Grant - Trading Risk: Enhanced Profitability through Risk Control. (Amazon Link)
Book addresses the importance of maintaining an active trading rhythm - feel it when the door opens and more volume comes in

Favorite other book:
Roy Longstreet - Viewpoints of a Commodity Trader - 2 pages in there are particularly helpful.
90% of the time most professional traders trade with 50% of their line or less.

PSYCHOLOGY:

A) Look into sports psychology books - $20 bucks buys you a great book

B) Emotions - less emotional the better - even temperament - get more even tempered with more experience

The best traders don't beat themselves up and don't let it go to their head if / when they are making big money

THINGS A BEGINNER NEEDS TO DO:

A) Get experience executing - 3 months of practice just getting out in 1 tick. Execution becomes automatic.

B) Newer you are to trading the shorter your holding period should be. The less time you are in the market the less risk you have. Longer you are in a trade the more objectivity you will lose

Could she recommend one strategy for a beginner to start with?

Take 2 time frames - 5 min and 15 minute use the two together and look for a pullback on the 15 min time frame in the direction of the trend but wait for the divergence on the 5 minute to trigger your entry.

Divergence - can give you a level of an absolute stop - shouldn't take out the last high or low. Don't want to fade the trend. Don't short a sell divergence when there are new highs being made daily.

WHAT IS SHE DOING NOW?

1 trick pony - does the same thing over and over but with bigger size. That's really the big secret. Find a niche. Find what you are good at and just learn to do it bigger size.

BOOKS MENTIONED:

Tuesday, June 10, 2008

Time To Buy the Financials

Maybe. Maybe not. Would certainly be a gutsy trade here.

I have an excellent indicator that is telling me its time to buy them for a trade though. I've been testing a new system that looks to buy and sell Ultra ETF's (2x) based on RSI signals. The basics are that it goes long when RSI(2) hits 10 and sells when RSI(2) hits 80. I've tested the system as a whole with around 50 ETF's that have enough volume and the win rate is incredible.

The UYG (Ultra Financials Proshares) signalled a buy on 6/3/08 at 27.76 and are currently trading at 26.00 even, offering an even greater opportunity to profit than usual. Note below the historical success of trading the UYG based on the system's criteria. Tests were run purchasing an even 10,000 of UYG on every signal. You can see that the system is up around 100% since the first trade was executed in May 07. Pretty impressive considering the system is buying UYG while its fallen from 70+ to 26 today.

Monday, June 9, 2008

GOOG - Taking what the market is giving me


Nice quick trade for some fast money. Another one of my favorites - very little risk as it was breaking the lows of the day. Cover when you feel the downside slowing. If it were to have turned around just after my short I'd have considered going long as if taking out the lows can't push GOOG down it is likely to head up.

Friday, June 6, 2008

Sea of Red


POT and MDR still holding pretty well. A lot can change in an hour though.

FSLR - Great Setup


FSLR looks ready to rumble.

Thursday, June 5, 2008

Two Charts to Rule Them All


POT and MDR both look great. I want to see POT clear 220 before I put on the rest of my position and MDR still needs some volume - when those conditions are met it'll hopefully be clear sailing. Also - Don't forget about AAPL and V.

Linda Raschke - Live Interview today at 1:30

Found this a few hours ago and thought it sounded interesting so just passing it along. I don't have any association with Rasche or TradingMarkets.com:

Click here to register - it's free

I'm signed up and going to give it a listen. Should be interesting.

Here is Raschke's bio from the site:

For those of you who are not familiar with Linda Raschke’s work, she began her professional trading career in 1981 as a market maker in equity options. Raschke is probably known mostly as a short-term S&P 500 futures trader, but she is active in several time frames, markets and trading styles.

Raschke has been a full-time professional trader for over 20 years. She began her trading career on the Pacific Coast Stock Exchange and later moved to the Philadelphia Stock Exchange. Linda was written up in Jack Schwager's book, The New Market Wizards and in Women of the Street by Sue Herera.

Don't try this at home


Whoops. 10 minutes is the difference between making money and MAKING MONEY.

Wednesday, June 4, 2008

Coal

Coal has had a heck of a run here and I'm wondering whether its time to think about getting short.

KOL is holding the trend line and the 21 day mov avg well thus far but the higher volume pullback immediately following a new high is bearish.

PCX has been incredible and I'm embarrassed to say I missed the whole move. Looking at this chart I see no reason to go anywhere near a short on the stock.


Three great looking stocks


If the market decides to move to the upside look for POT, AAPL and V to lead. All three look great at new highs on volume.

On the year POT and AAPL are my two biggest earning symbols. I'm net negative on V though looking at the chart its hard to see why - it's been pretty nice since the IPO.

Favorite Trading Sites

I added two new links to my list of "Favorite Trading Sites" tonight:

1) Bulkowski's Blog: Thomas Bulkowski is the author of Encyclopedia of Chart Patterns, Getting Started in Chart Patterns, as well as a few other books. I just recently found his blog and am already a big fan.

2) Dan Zanger's Trader's Nation Weekly Audio Interview: This is an audio interview that is conducted every Wednesday morning with Dan and available all week in an archived form. I find it helpful to refocus my thoughts on the leaders in the market. In today's interview he mentioned AAPL, RIMM, MON, MOS, POT, CF, EXM, DRYS, MA and V.

Tuesday, June 3, 2008

IPI


Setting up for a nice long if it clears 49.50 with volume. IPI is Intrepid Potash, the best pure play on potash fertilizer that exists in the trading world. They announced earnings yesterday so we should be clear of any potential downside surprises.

Monday, June 2, 2008

HOC - Tasty setup above 47.50 today


Refiners are on fire - check out HOC

May 2008 - Account Performance

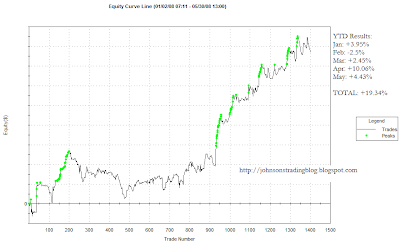
May was a tough month for me. As you can see in the chart below I started out pretty well, moved sideways for a bit only to then have a great string of winning trades which was then followed by a poor end to the month.

May 2008 Equity Curve:


I've consistently struggled with trading after a run of success. As soon as I get comfortable making money with certain sized trades I inevitably try to ramp up my size, and this of course leads to emotion which does NOT help my returns.

To combat the size problems my goal for June is to start real slow, stay at normal to less than normal sized trades and work my way to a consistent and profitable month with a higher return than the 4.43% I achieved in May.

Some statistics for May:
295 trades, 45.42% of them were profitable
Long trades: 152 trades, 74 profitable for 48.68%
Short trades: 143 trades, 60 profitable for 41.96%

Despite less than 50% of both my long and short trades being profitable in May I found a way to make money both long and short as long trades accounted for 60.4% of my portfolio gains and short trades accounted for 39.6%. Despite the gains my percentage of profitable trades were well below my year to date numbers, especially on the short side (YTD: 53% profitable). This is something I'd like to improve on in June.

YTD Results (through May 31):
Jan: +3.95%
Feb: -2.5%
Mar: +2.45%
Apr: +10.06%
May: +4.43%
TOTAL: +19.34%

Year To Date Chart:


Sunday, June 1, 2008

Dan Zanger Interview

I've learned quite a bit from Dan Zanger in the near one year that I've been a member of his chat room. He has a unique style of trading in which he focuses solely on the best stocks (strongest EPS Growth) in the leading sectors. He'll often own only 3-7 stocks at a time and seems to have the great majority of his money in only 1-2 of those names.

Below is a three part interview iTV conducted with him from Jan 8, 2005. The 3 videos total about 23 minutes in length.

In the interview he notes among other gems that his biggest single lesson of 2005 was:

"Not to be in the market all the time and to trade far less than I do, far less. I really have found that the market may have 2 big moves during the year and they may last 6, 8, 10, 12 weeks and other than that they just exhaust themselves after that. And really the rest of the time the market is just consolidating the gains. The big lesson for me this year has just been to trade less, trade less, trade fewer stocks, own just about 4 stocks that are really powerhouse stocks when the market bottoms out. Then the market will take off and run for maybe 10, 12, 13, 14 weeks, whatever it does and then trade out and go to golf, go to swimming, go to cash, just have fun and enjoy and wait for everything to setup and do it again. It takes about 4-5 months for everything to set up again."


Link: Zanger's Website - Chartpattern.com